| |

| |
R E A L E
S T A T E M A P S
The majority
of our work is for clients in the field of real estate. Our maps are used
for everything from selling suburban houses to analyzing central city
office markets to marketing a portfolio of regional malls.
|
|
|
|
 |
A
diagram for a real estate offering shows how this California office-hotel
complex fits together. |
| |
 |
Equity
Office Trust wanted to emphasize its Manhattan properties and nearby amenities
in this office leasing map. |
| |
 |
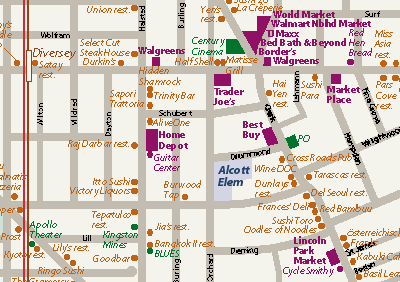
Maps showing neighborhood amenities such as schools, shopping,
transit, and other points of interest helps Koenig & Strey and other real estate companies market new condominiums.
|
| |
 |
An
axonometric view shows the relative sizes of these Phoenix buildings and
how they are clustered on their downtown site. |
| |
 |
A
presentation to a real estate portfolio manager graphically showed how many
nearby properties in Washington, D.C., had been purchased by overseas investors
and REITs. |
| |
 |
Another
tool for potential investors is the “stacking plan,” graphically
showing when various leases will expire and blocks of space in an office
building will become available. |
| |
 |
A
cross-section shows how a multilevel shopping mall, two hotels, four office
buildings, apartments, and a parking garage are stacked over the Massachusetts
Turnpike. |
| |
 |
A
detailed map of retailers in San Francisco’s Union Square district
gives context for investors studying a building being offered for sale. |
|
|
 |
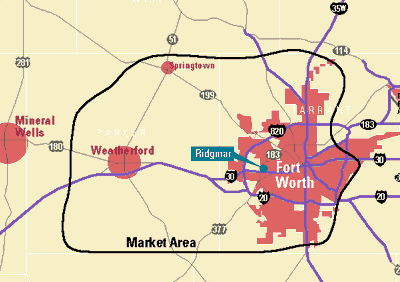
A
map shows potential tenants that the market area for Ridgmar Mall extends
far into the rural areas west of Ft Worth, Texas. |
|


