
|
T H E M A T I C A N D Sometimes extensive detail makes a place come alive for map users; sometimes simplification or an unusual viewpoint clarifies a complex area. |
 |
Retail investment offerings usually include demographic maps to show investors the population density and household income in nearby census tracts. |
 |
A retail and entertainment study by Economics Research Associates looked separately at winter and summer, daytime and nighttime attractions. We used color palettes to distinguish the various maps, including this one for summer nights. |
|
||||
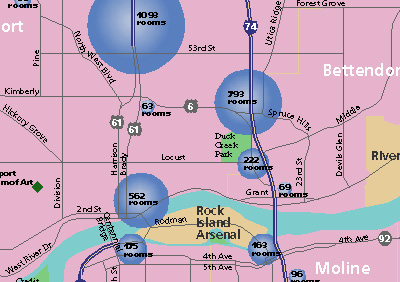 |
A graduated-circle diagram, done for a market study, graphically shows concentrations of hotel rooms in the Quad Cities. |
|
|
 |
Maps done for Chicago’s Metropolis 2020 organization dramatically show how the region’s built-up area now extends beyond the reach of transit service. |
|
|
 |
An efficient and graphic way to show office space distribution for this market study was an axonometric diagram indicating the buildings’ bulk. |
|
|